|
Current Research Enhanced Resistance Training Performance via the Neutralization of Lactic Acid with Sodium Bicarbonate
Figure 1. Group differences as identified by mean weight used in the Back Squat 1RM test in 4 subsequent training sessions. The figure demonstrates that there were increases in weight in the SB group compared to the Control group (P < 0.05).

Figure 2. Group differences as identified by mean weight used in the Barbell Row 1RM test in 4 subsequent training sessions. The figure demonstrates that there were increases in weight in the SB group compared to the Control group (P < 0.05).

Figure 3. Group differences as identified by mean weight used in the Military Press 1RM test in 4 subsequent training sessions. The figure demonstrates that there were increases in weight in the SB group compared to the Control group (P < 0.05).
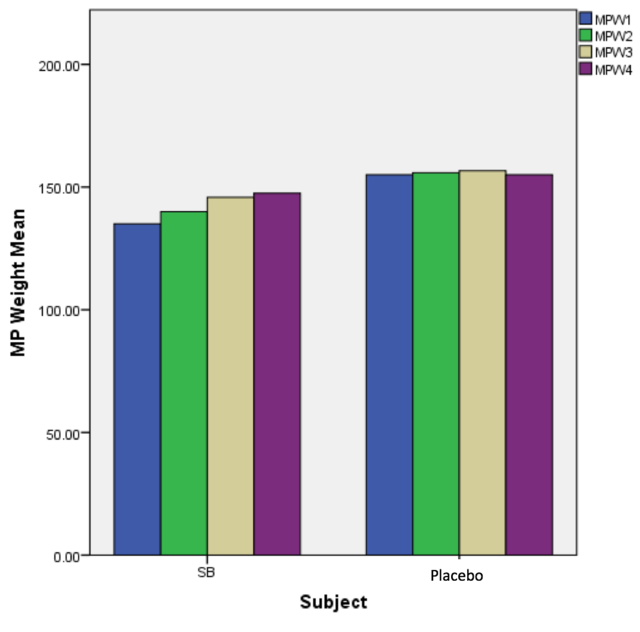
Figure 4. Group differences as identified by mean weight used in the Bench Press 1RM test in 4 subsequent training sessions. The figure demonstrates that there were increases in weight in the SB group compared to the Control group (P < 0.05).
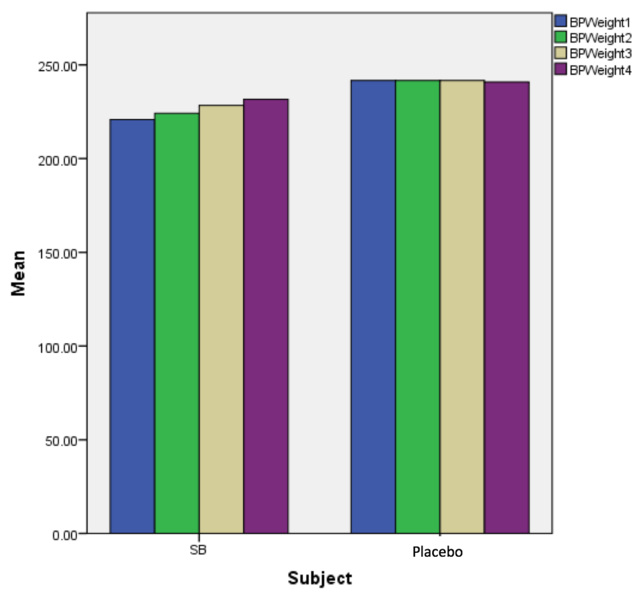
Figure 5. Group differences as identified by mean repetitions performed in the Incline Dumbbell Press endurance test in 4 subsequent training sessions. The figure demonstrates that there were significant increases in repetitions performed in the SB group compared to the Control group (P < 0.05).
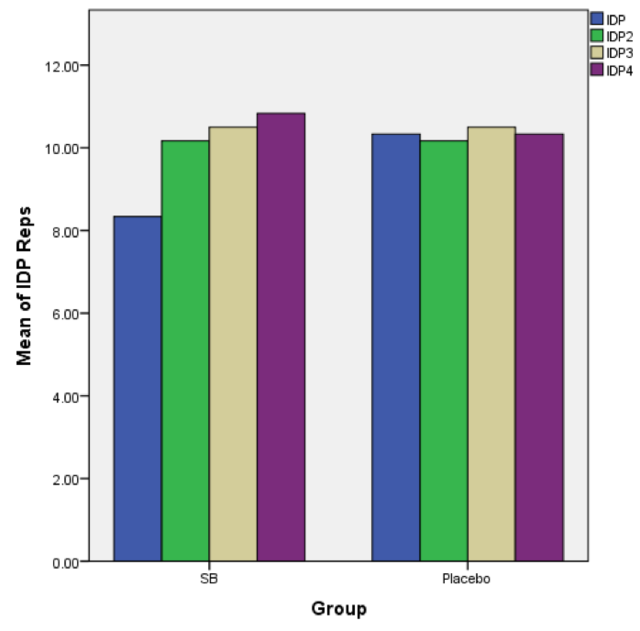
Figure 6. Group differences as identified by mean repetitions performed in the Lat Pull-down endurance test in 4 subsequent training sessions. The figure demonstrates that there were reasonable increases in repetitions performed in the SB group compared to the Control group (P < 0.05).
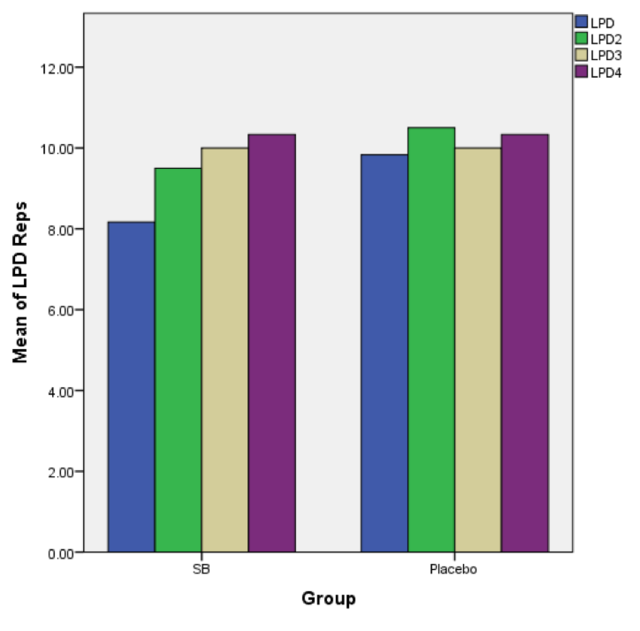
Figure 7. Group differences as identified by mean repetitions performed in the Leg Press endurance test in 4 subsequent training sessions. The figure demonstrates that there were significant increases in repetitions performed in the SB group compared to the Control group (P < 0.05).

Figure 8. Group differences as identified by mean repetitions performed in the Lateral Raise endurance test in 4 subsequent training sessions. The figure did not indicate significant increases in repetitions performed in the SB group compared to the Control group (P > 0.05)

Table 1. age (yrs), height (m), weight (lbs), body mass index (BMI) calculations for all 12 subjects
| Descriptive Statistics |
| |
N |
Mean |
Std. Deviation |
| Age |
12 |
20.0000 |
.95346 |
| Height |
12 |
1.7833 |
.06746 |
| Weight |
12 |
173.0717 |
9.90828 |
| BMI |
12 |
25.0833 |
1.08362 |
| Valid N (listwise) |
12 |
|
|
Table 2. Soreness scale values (mean ± SD) for both groups
| Group Statistics |
| |
Subject |
N |
Mean |
Std. Deviation |
Std. Error Mean |
| Soreness |
SB |
6 |
79.8333 |
6.40052 |
2.61300 |
| Placebo |
6 |
52.0000 |
7.37564 |
3.01109 |
Table 3. Independent sample t-test for soreness scale
| Independent Samples Test |
| |
Levene's Test for Equality of Variances |
t-test for Equality of Means |
| F |
Sig. |
t |
df |
Sig. (2-tailed) |
Mean Difference |
Std. Error Difference |
95% Confidence Interval of the Difference |
| Lower |
Upper |
| Soreness |
Equal variances assumed |
.703 |
.421 |
6.981 |
10 |
.000 |
27.83333 |
3.98678 |
18.95023 |
36.71644 |
| Equal variances not assumed |
|
|
6.981 |
9.805 |
.000 |
27.83333 |
3.98678 |
18.92628 |
36.74039 |
Table 4. Intensity scale values (mean ± SD) for both groups
| Group Statistics |
| |
Subject |
N |
Mean |
Std. Deviation |
Std. Error Mean |
| Intensity |
SB |
6 |
86.6667 |
2.94392 |
1.20185 |
| Placebo |
6 |
59.0000 |
5.83095 |
2.38048 |
Table 5. Independent sample t-test for intensity scale
| Independent Samples Test |
| |
Levene's Test for Equality of Variances |
t-test for Equality of Means |
| F |
Sig. |
t |
df |
Sig. (2-tailed) |
Mean Difference |
Std. Error Difference |
95% Confidence Interval of the Difference |
| Lower |
Upper |
| Intensity |
Equal variances assumed |
.984 |
.345 |
10.375 |
10 |
.000 |
27.66667 |
2.66667 |
21.72496 |
33.60837 |
| Equal variances not assumed |
|
|
10.375 |
7.394 |
.000 |
27.66667 |
2.66667 |
21.42840 |
33.90493 |
Table 6. Improvement scale values (mean ± SD) for both groups
| Group Statistics |
| |
Subject |
N |
Mean |
Std. Deviation |
Std. Error Mean |
| Improvement |
SB |
6 |
85.0000 |
4.19524 |
1.71270 |
| Placebo |
6 |
47.6667 |
4.92612 |
2.01108 |
Table 7. Independent sample t-test for improvement scale
| Independent Samples Test |
| |
Levene's Test for Equality of Variances |
t-test for Equality of Means |
| F |
Sig. |
t |
df |
Sig. (2-tailed) |
Mean Difference |
Std. Error Difference |
95% Confidence Interval of the Difference |
| Lower |
Upper |
| Improvement |
Equal variances assumed |
.018 |
.897 |
14.133 |
10 |
.000 |
37.33333 |
2.64155 |
31.44760 |
43.21907 |
| Equal variances not assumed |
|
|
14.133 |
9.753 |
.000 |
37.33333 |
2.64155 |
31.42730 |
43.23936 |
- Artioli, G. G., Gualano, B., Coelho, D. F., Benatti, F. B., Gailey, A. W., & Lancha, A. H. (2007). Does sodium-bicarbonate ingestion improve simulated judo performance? International Journal of Sport Nutrition and Exercise Metabolism, 17(2), 206–217.
- Baechle, Thomas R., and Roger W. Earle, eds. Essentials of Strength Training and Conditioning. 3rd ed. N.p.: National Strength and Conditioning Association, 2008.
- Baranowski, T. (1988). Validity and reliability of self-report of physical activity: An information processing perspective. Research Quarterly, 59, 314-327.
- Benton, M. J., Raab, S., & Waggener, G. T. (2013). Effect of Training Status on Reliability of One Repetition Maximum Testing in Women: Journal of Strength and Conditioning Research, 27(7), 1885–1890. http://doi.org/10.1519/JSC.0b013e3182752d4a
- Bloomer, R. J., Farney, T. M., Trepanowski, J. F., McCarthy, C. G., Canale, R. E., & Schilling, B. K. (2010). Comparison of pre-workout nitric oxide stimulating dietary supplements on skeletal muscle oxygen saturation, blood nitrate/nitrite, lipid peroxidation, and upper body exercise performance in resistance trained men. Journal of the International Society of Sports Nutrition, 7(1), 16. http://doi.org/10.1186/1550-2783-7-16
- Duncan, M. J., Weldon, A., & Price, M. J. (2014). The Effect of Sodium Bicarbonate Ingestion on Back Squat and Bench Press Exercise to Failure: Journal of Strength and Conditioning Research, 28(5), 1358–1366. http://doi.org/10.1519/JSC.0000000000000277
- Finn, H. T., Brennan, S. L., Gonano, B. M., Knox, M. F., Ryan, R. C., Siegler, J. C., & Marshall, P. W. M. (2014). Muscle Activation Does Not Increase After a Fatigue Plateau Is Reached During 8 Sets of Resistance Exercise in Trained Individuals. Journal of Strength, 28(5), 1226–1234. http://doi.org/10.1097/JSC.0000000000000226
- Lancha Junior, A. H., de Salles Painelli, V., Saunders, B., & Artioli, G. G. (2015). Nutritional Strategies to Modulate Intracellular and Extracellular Buffering Capacity During High-Intensity Exercise. Sports Medicine. http://doi.org/10.1007/s40279-015-0397-5
- M. Driller, A. W. (2012). The effects of NaHCO3 and NaCl loading on hematocrit and high-intensity cycling performance. Journal of Exercise Physiology (online), 15, 47–57.
- Maughan, R. (n.d.). Encyclopedia of Sports Medicine. In Nutrition in Sport (Vol. 7, p. IOC Medical Commission).
- McMaster, D. T., Gill, N., Cronin, J., & McGuigan, M. (2014). A Brief Review of Strength and Ballistic Assessment Methodologies in Sport. Sports Medicine, 44(5), 603–623. http://doi.org/10.1007/s40279-014-0145-2
- Percival, M. E., Martin, B. J., Gillen, J. B., Skelly, L. E., MacInnis, M. J., Green, A. E., … Gibala, M. J. (2015). Sodium bicarbonate ingestion augments the increase in PGC-1α mRNA expression during recovery from intense interval exercise in human skeletal muscle. Journal of Applied Physiology, jap.00048.2015. doi.org/10.1152/japplphysiol.00048.2015
- Rognmoa, O., Hetland, E., Helgerud, J., & Hoff, J. (2004). High intensity aerobic interval exercise is superior to moderate intensity exercise for increasing aerobic capacity in patients with coronary artery disease. European Journal of Preventive Cardiology, 11(3), 216–222. http://doi.org/10.1097/01.hjr.0000131677.96762.0c
- Sallis, J. F., & Saelens, B. E. (2000). Assessment of physical activity by self-report: status, limitations, and future directions. Research Quarterly for Exercise and Sport, 71(2 Suppl), S1–14.
- Siegler, J., Keatley, S., Midgley, A., Nevill, A., & McNaughton, L. (2008). Pre-Exercise Alkalosis and Acid-Base Recovery. International Journal of Sports Medicine, 29(7), 545–551. http://doi.org/10.1055/s-2007-989261
- Warnecke, R.B., Johnson, T.P., Chavez, N., Sudman, S., O'Rourke, D.P., Lacey, L., & Horm,J. (997). Improving question wording in surveys of culturally diverse populations. Annals of Epidemioiog», 7, 334-342.
- Webster, M., Webster, M., Crawford, R., & Gladden, B. (1993). Effect of sodium bicarbonate ingestion on exhaustive resistance exercise performance. American College of Sports Medicine, 0195-9131(93), 960–965.
- Williams, M. (1992). Ergogenic and ergolytic substances. Medical Science Sports Exercise, 9(24), 344–8.
Appendix
Figure 1. Group differences as identified by mean weight used in the Back Squat 1RM test in 4 subsequent training sessions. The figure demonstrates that there were increases in weight in the SB group compared to the Control group (P < 0.05).
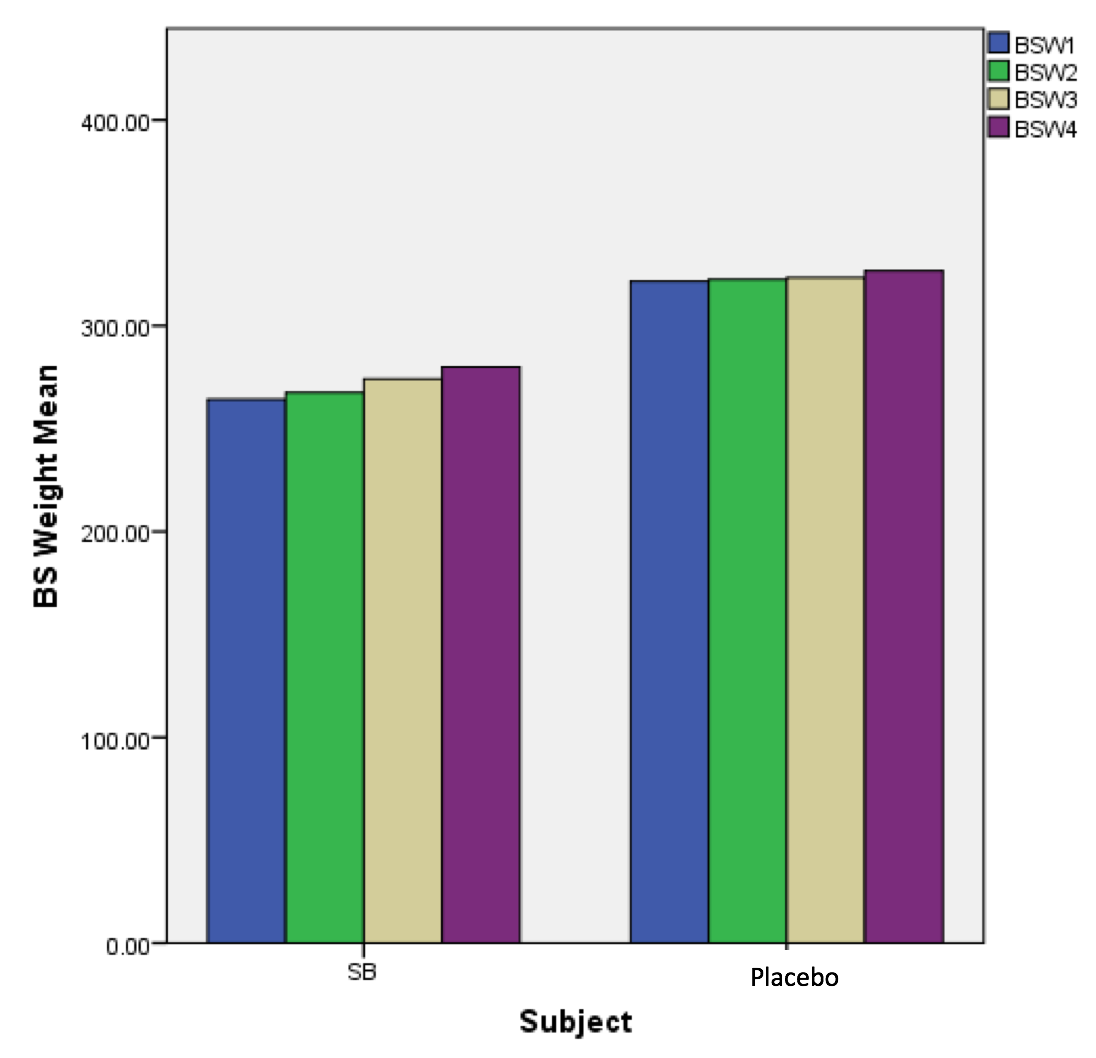
Figure 2. Group differences as identified by mean weight used in the Barbell Row 1RM test in 4 subsequent training sessions. The figure demonstrates that there were increases in weight in the SB group compared to the Control group (P < 0.05).
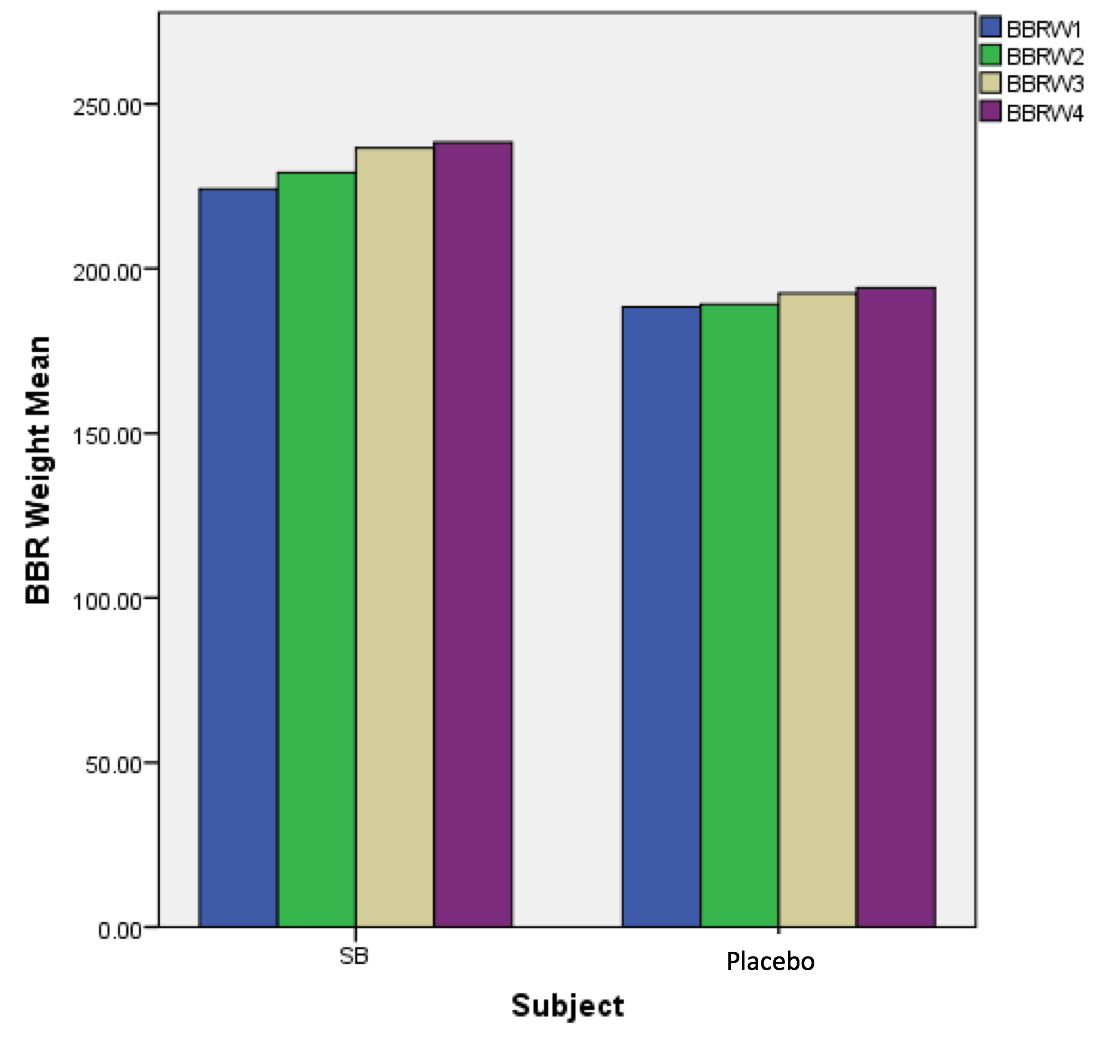
Figure 3. Group differences as identified by mean weight used in the Military Press 1RM test in 4 subsequent training sessions. The figure demonstrates that there were increases in weight in the SB group compared to the Control group (P < 0.05).

Figure 4. Group differences as identified by mean weight used in the Bench Press 1RM test in 4 subsequent training sessions. The figure demonstrates that there were increases in weight in the SB group compared to the Control group (P < 0.05).

Figure 5. Group differences as identified by mean repetitions performed in the Incline Dumbbell Press endurance test in 4 subsequent training sessions. The figure demonstrates that there were significant increases in repetitions performed in the SB group compared to the Control group (P < 0.05).

Figure 6. Group differences as identified by mean repetitions performed in the Lat Pull-down endurance test in 4 subsequent training sessions. The figure demonstrates that there were reasonable increases in repetitions performed in the SB group compared to the Control group (P < 0.05).
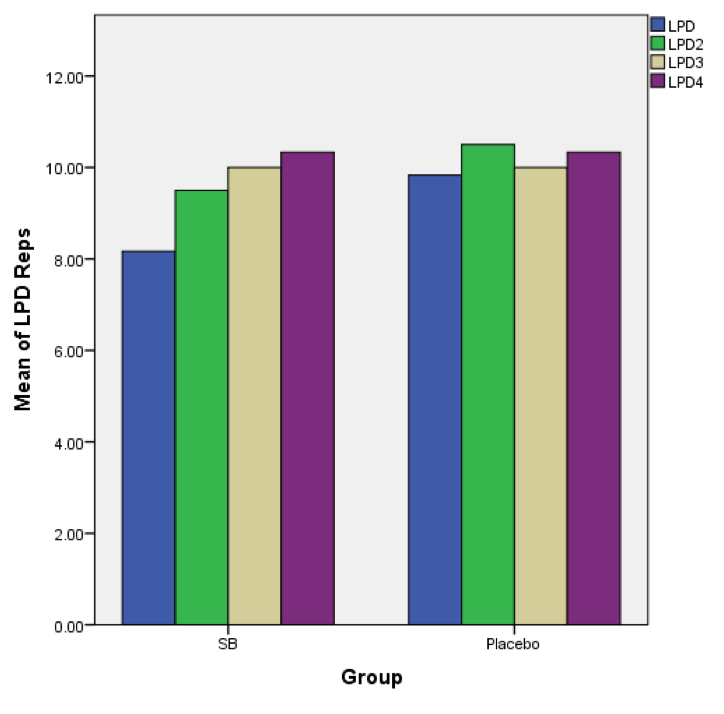
Figure 7. Group differences as identified by mean repetitions performed in the Leg Press endurance test in 4 subsequent training sessions. The figure demonstrates that there were significant increases in repetitions performed in the SB group compared to the Control group (P < 0.05).
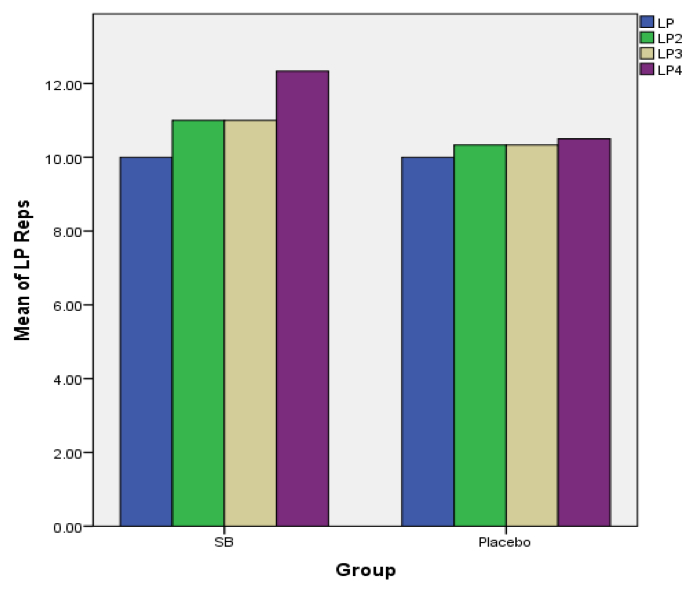
Figure 8. Group differences as identified by mean repetitions performed in the Lateral Raise endurance test in 4 subsequent training sessions. The figure did not indicate significant increases in repetitions performed in the SB group compared to the Control group (P > 0.05)
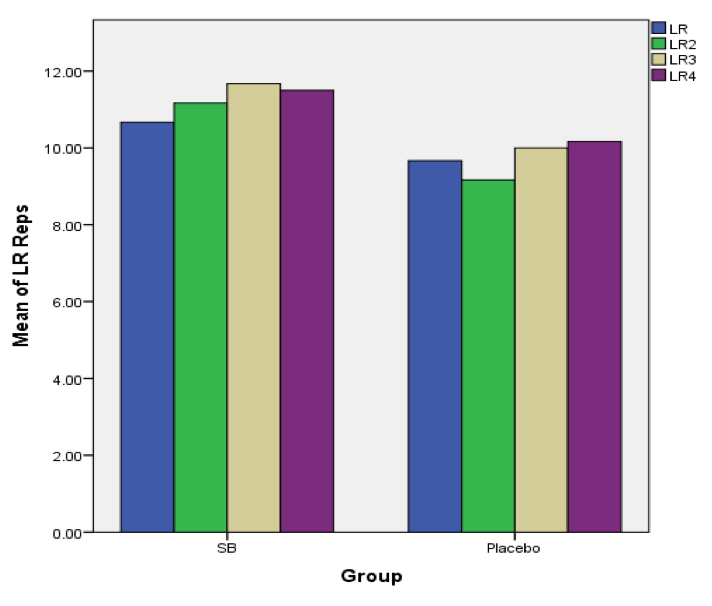
Table 1. age (yrs), height (m), weight (lbs), body mass index (BMI) calculations for all 12 subjects
| Descriptive Statistics |
| |
N |
Mean |
Std. Deviation |
| Age |
12 |
20.0000 |
.95346 |
| Height |
12 |
1.7833 |
.06746 |
| Weight |
12 |
173.0717 |
9.90828 |
| BMI |
12 |
25.0833 |
1.08362 |
| Valid N (listwise) |
12 |
|
|
Table 2. Soreness scale values (mean ± SD) for both groups
| Group Statistics |
| |
Subject |
N |
Mean |
Std. Deviation |
Std. Error Mean |
| Soreness |
SB |
6 |
79.8333 |
6.40052 |
2.61300 |
| Placebo |
6 |
52.0000 |
7.37564 |
3.01109 |
Table 3. Independent sample t-test for soreness scale
| Independent Samples Test |
| |
Levene's Test for Equality of Variances |
t-test for Equality of Means |
| F |
Sig. |
t |
df |
Sig. (2-tailed) |
Mean Difference |
Std. Error Difference |
95% Confidence Interval of the Difference |
| Lower |
Upper |
| Soreness |
Equal variances assumed |
.703 |
.421 |
6.981 |
10 |
.000 |
27.83333 |
3.98678 |
18.95023 |
36.71644 |
| Equal variances not assumed |
|
|
6.981 |
9.805 |
.000 |
27.83333 |
3.98678 |
18.92628 |
36.74039 |
Table 4. Intensity scale values (mean ± SD) for both groups
| Group Statistics |
| |
Subject |
N |
Mean |
Std. Deviation |
Std. Error Mean |
| Intensity |
SB |
6 |
86.6667 |
2.94392 |
1.20185 |
| Placebo |
6 |
59.0000 |
5.83095 |
2.38048 |
Table 5. Independent sample t-test for intensity scale
| Independent Samples Test |
| |
Levene's Test for Equality of Variances |
t-test for Equality of Means |
| F |
Sig. |
t |
df |
Sig. (2-tailed) |
Mean Difference |
Std. Error Difference |
95% Confidence Interval of the Difference |
| Lower |
Upper |
| Intensity |
Equal variances assumed |
.984 |
.345 |
10.375 |
10 |
.000 |
27.66667 |
2.66667 |
21.72496 |
33.60837 |
| Equal variances not assumed |
|
|
10.375 |
7.394 |
.000 |
27.66667 |
2.66667 |
21.42840 |
33.90493 |
Table 6. Improvement scale values (mean ± SD) for both groups
| Group Statistics |
| |
Subject |
N |
Mean |
Std. Deviation |
Std. Error Mean |
| Improvement |
SB |
6 |
85.0000 |
4.19524 |
1.71270 |
| Placebo |
6 |
47.6667 |
4.92612 |
2.01108 |
Table 7. Independent sample t-test for improvement scale
| Independent Samples Test |
| |
Levene's Test for Equality of Variances |
t-test for Equality of Means |
| F |
Sig. |
t |
df |
Sig. (2-tailed) |
Mean Difference |
Std. Error Difference |
95% Confidence Interval of the Difference |
| Lower |
Upper |
| Improvement |
Equal variances assumed |
.018 |
.897 |
14.133 |
10 |
.000 |
37.33333 |
2.64155 |
31.44760 |
43.21907 |
| Equal variances not assumed |
|
|
14.133 |
9.753 |
.000 |
37.33333 |
2.64155 |
31.42730 |
43.23936 |
Save Citation » (Works with EndNote, ProCite, & Reference Manager)
APA 6th
Indorato, D. (2016). "Enhanced Resistance Training Performance via the Neutralization of Lactic Acid with Sodium Bicarbonate." Inquiries Journal/Student Pulse, 8(03). Retrieved from http://www.inquiriesjournal.com/a?id=1375
MLA
Indorato, Daniel. "Enhanced Resistance Training Performance via the Neutralization of Lactic Acid with Sodium Bicarbonate." Inquiries Journal/Student Pulse 8.03 (2016). <http://www.inquiriesjournal.com/a?id=1375>
Chicago 16th
Indorato, Daniel. 2016. Enhanced Resistance Training Performance via the Neutralization of Lactic Acid with Sodium Bicarbonate. Inquiries Journal/Student Pulse 8 (03), http://www.inquiriesjournal.com/a?id=1375
Harvard
INDORATO, D. 2016. Enhanced Resistance Training Performance via the Neutralization of Lactic Acid with Sodium Bicarbonate. Inquiries Journal/Student Pulse [Online], 8. Available: http://www.inquiriesjournal.com/a?id=1375
Suggested Reading from Inquiries Journal
This article argues that performance enhancing drugs (PEDs) ought to be allowed across all elite sporting competitions for athletes over the age of 16 so long as consuming them does not pose a significant risk to their health. I begin with a brief explanation of the current state of PED use in professional sports before assessing... MORE»
In recent decades, research has focused on the powerful effects of advertising on negative body image. While researchers have studied how the general female population reacts to various advertising techniques, little research has been published on how female collegiate athletes are affected by fitness advertisements. This study... MORE»
Listening to music for relaxation is common among students to counter the effects of stress or anxiety while completing difficult academic tasks. Some studies supporting this technique have shown that background music promotes cognitive performance while other studies have shown that listening to music while engaged in complex cognitive... MORE»
The purpose of this study was to determine whether Generation Y women respond more to athletic ads that embodied a second-wave feminist ideology or a third-wave, post-structuralist ideology. A focus group was conducted and its findings revealed that the women's ideological preferences were not based on their generation, but their... MORE»
Latest in Health Science
2022, Vol. 14 No. 03
The use of synthetic opioids in the United States in the past 30 years has created an epidemic the likes of which our healthcare and law enforcement systems have never before encountered. Although some opioid analogs, like fentanyl, were developed... Read Article »
2021, Vol. 13 No. 10
Romanies are one of history’s most misunderstood ethnic populations. Since medieval times, they have faced slavery, forced assimilation, sterilization, genocide, and other forms of ethnic cleansing. Their cultural and historical persecution... Read Article »
2021, Vol. 13 No. 09
The calcium-binding protein apoaequorin has been studied for its possible indication to improve human cognition and memory. Faculty at Quincy Bioscience developed Prevagen with this in mind, claiming its apoaequorin-formulated supplement may decrease... Read Article »
2021, Vol. 13 No. 05
Areas of the world found to harbor the people with exceptional lifespans are known as a Longevity Blue Zone (LBZ). LBZ’s are areas around the world that have an unusual concentration of centenarians. This paper investigates the link between... Read Article »
2020, Vol. 12 No. 12
Although spirituality has been an essential part of healing for most of mankind, modern medicine is more likely to embrace a mechanistic view of the human body where illness is an engineering problem and the body is the sum of discrete parts, rather... Read Article »
2020, Vol. 12 No. 10
Ketamine, described by the chemical formula C13H16ClNO, is most commonly associated with adolescent and adult recreational drug users and ravers who abuse this drug to experience a euphoric and dissociative state. Although this drug is a federal... Read Article »
2020, Vol. 12 No. 10
The ketogenic diet, or keto diet for short, is a fad diet that has gained significant attention in recent years as a popular weight loss approach. The diet is characterized by a depletion of carbohydrates which in turn place the body in a state... Read Article »
|