From The Developing Economist VOL. 1 NO. 1Efficient Pricing of Carbon in the EU and its Effect on Consumers
IN THIS ARTICLE
KEYWORDS
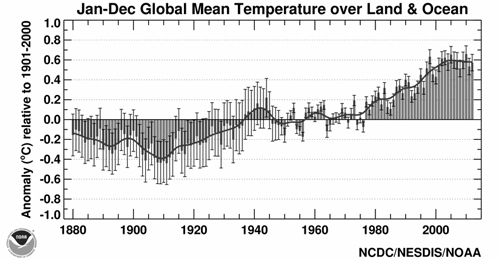
AbstractA European single market for electricity is modeled to find the optimal portfolio of energy generation technologies in the presence of a carbon tax. The goal is to find the Pareto optimal carbon tax rate such that both carbon emissions and production costs are minimized. Different sources of electricity– namely coal, natural gas, nuclear, wind, offshore wind, and solar– are given levelized costs and carbon dioxide emissions (CO2) on a per megawatt-hour (MWh) basis. 20,000 energy portfolios, each with different allocations of the respective generation techniques, are generated via a Monte Carlo process and subsequently evaluated by their perMWhcost and emissions. The cost of each generation technology is related to the upfront capital expense, the variable operations and resource costs (O&M), the amount of CO2 it produces and the EU-wide carbon tax rate. This taxrate is increased until the most cost-efficient portfolio is also the least CO2 producing– thus finding the optimal carbon taxrate for aligning environmental and economic interests. Data extracted from this model suggests that this efficient price is around $80 USD per ton of CO2 The effective production price per MWh from the simulation is then compared to the average industrial power price for each of the EU-member states in order to evaluate the effect of an EU-wide carbon tax on end-users. The optimal portfolio recommended by the simulation, in conjunction with transport via a Pan-European SuperGrid, will be able to supply power at a similar (±5%) price to the current EU 27 average while dramatically reducing greenhouse gas emissions. I. The Problem with CarbonOver the past 100 years the global temperature has risen 1.53 °F. However, since ocean temperature tends to rise slower than land, the overall effect is more pronounced for Earth's landmasses.
Figure 1: Rise in Global Temperatures Since 1880 (NOAA, 2011) While there are those who contest the science, the vast majority of climatologists attribute this sustained rise in global temperatures to the increased use of fossil fuels for transportation and power. In the US, the largest source of these CO2 emissions come from the generation of electric power followed by transportation. While no similar data could be found for the EU, Europe's lower car-utilization rate suggests that its percentage of CO2 emissions from electric generation is higher than that of the US (global average from electric generation is roughly 1⁄3). Clearly, if the EU, and the world, are serious about reducing greenhouse gas emissions, we will have to make changes to the way we generate electric power. Carbon in the EU's Political LandscapeCurrently there is no EU-wide carbon tax. In the 1990's a carbon tax was proposed to the EU Parliament, but this measure failed. However, in 2005 the EU began its emissions trading scheme (EU ETS), commonly referred to as "cap and trade". Under the EU ETS a maximum allowance of greenhouse gases (GHG) is set for each of the 11,000 plants under the regulation. If the operator emits more than its allotted amount of carbon, it is forced to buy carbon permits from other users on the market, thus constraining the aggregate emissions level (European Commission, 2013).
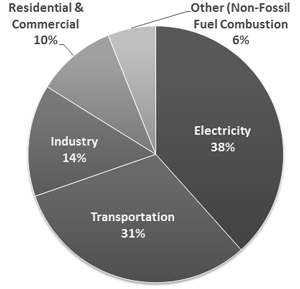
Figure 2: Breakdown of Greenhouse Gas Emissions by Source (EPA, 2013) Carbon in the EU's Political LandscapeOpponents of carbon taxation argue that it is a regressive tax, since it will disproportionally hurt lower-income households. A tax on carbon would cause production costs of electricity to rise, a cost that would ultimately be passed on to the consumer. Assuming all users are charged the same rate for power, the rate increase would represent a larger share of lower-income families income. Additionally, more affluent families are able to afford the upfront capital expenditure associated with buying new, energy efficient appliances, LEED Certified homes, home solar panels, etc. while poorer household will remain reliant on electricity-produced from burning fossil fuels. Cap and Trade vs. Carbon TaxTheoretically, both the Cap and Trade and a carbon taxation scheme will achieve the same outcome of reducing GHG emissions, however in practice they behave quite differently.
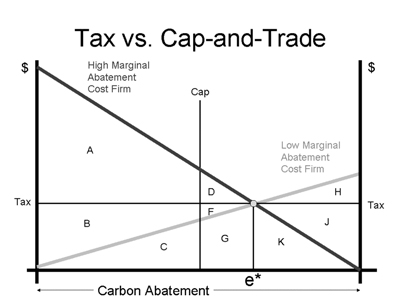
Figure 3: Carbon Tax vs. Cap and Trade (Environmental Economics) In the EU, all existing power stations were issued a base carbon allowance for free, essentially making the scheme free for them as long as they maintained current emissions levels. On the other hand, a carbon tax will impose immediate costs on all emitters as each unit of carbon has a price. This helps explain why this program was able to pass the ballot while taxation was not (Taschini, 2013). Carbon taxation is more difficult to implement because the price at which it is taxed at is extremely important– too low and industry might just pay the tax and continue emitting GHG, too high and consumers suffer dramatically higher prices. It is this pricing problem that this paper centers on. II. Carbon from ElectricityIn addition to being the largest single source of greenhouse gases, electric generation is amongst the low-hanging fruit when it comes to reducing global emissions. Chiefly this is because:
Electric power demand is predicted to increase in Europe as more and more tasks traditionally fulfilled via internal combustion (IC) or natural gas (e.g. transport and home heating) become electric. This in-and-of itself is good– large-scale electric generation is much cleaner and energy efficient than IC, however this will force governments and utility companies to build new generation stations. New power plant construction in-turn raises the question of what type of power plants the EU should invest in.
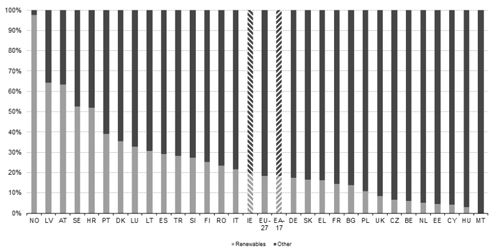
Figure 4: Share of Renewables in Electricity Production (Eurostat, 2012) The Current State of Power Generation in EuropeEurope varies greatly when it comes to the methods used to generate electricity. Norway, produces over 90% of their power from renewable sources, while others such as Malta produce almost 0% of their power using renewables. Overall, the EU 27 stands at about 18% generation from renewables. Between 1990 and 2008, the share of electricity produced from renewable sources increased by 288 TWh, an increase of 87.2% (European Environmental Agency, 2011). As seen in Figure 4 for the vast majority of European nations, electric power is produced primarily by conventional thermal, i.e. burning a fuel to produce heat. Traditionally this has meant coal and oil, but increasingly the world has shifted towards nuclear and natural gas as its main heat sources. As we will see, the various methods of producing this heat have dramatically different environmental impacts.
Figure 5: Electric Generation by Fuel Source (Eurostat, 2012) Methods of Generating ElectricityAll types of electric generation1 are derived from the same fundamental principle: Faraday's Law. Faraday's Law states that a voltage is induced by a change in the magnetic environment of a coil. Electric generators operate on this principle: 1) magnets are placed along a rotating shaft 2) this shaft is placed inside to a coil of wires 3) the shaft is connected to a source of rotary motion (turbine, engine, etc.) 4) the spinning of the shaft causes a change in the magnetic field and 5) an electric voltage is produced. Fossil fuels enter the equation to provide the rotary motion. In the most general sense, some heat source (usually combustion) causes a pressure increase in steam which in turn causes a fan blade to spin. Renewable sources sidestep the combustion process and, in the case of hydroelectric and wind, use the fluid flow to turn the fan blade, or the thermal energy of the sun to heat water as in the case of solar thermal.2 As mentioned earlier, the type of fuel used as the heat source dramatically effects the output of CO2 and other pollutants (NOx) per MWh. Renewable sources produce zero GHG emissions, while coal and natural gas produce CO2 as a byproduct of combustion. The relative emissions are shown below:
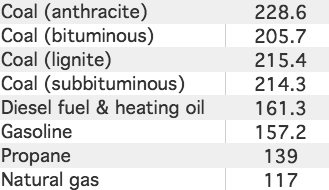
Figure 6: Pounds of CO2 Emitted per Million BTU (US Energy Information Administration, 2013) As seen above, natural gas produces about 57% less CO2 than bituminous coal (the most commonly used for electricity generation). Thus, it follows that replacing all existing coal power plants with natural gas would reduce GHG emissions by over half! Perhaps a more striking difference than the relative CO2 emissions is the cost difference between sources. When discussing the cost per MWh, we must first establish the different factors internal to the pricing:
The first four costs are self-explanatory, but the last is a bit subtle. The capacity factor3 (CF) is the percent of time that the source will run– a measure of intermittence. For example, if a 1 MW turbine produced 3000h MW over the course of a year, it would have a capacity factor of 34%. Thus, a 100 MW solar installment (CF=.25) could not reliably provide as much power as a 100 MW gas turbine (CF=.87). More formally:
Capacity factors have large implications on the optimal energy portfolio since a certain base load of power will be needed at all times. This suggests that a global optima of cost and emissions exists since a grid comprised completely of renewables would require a nominal capacity of three times the actual requirement– a three-fold cost increase. This paper aims to find the Pareto optimal combination of cheap, reliable, polluting thermals with expensive, intermittent, and clean renewables. Another important distinction is that between Dispatchable and NonDispatchable. Dispatchable technologies are those that can be switched on and off, as well as being able to ramp up or down production based on demand. Dispatchable technologies are more valuable to grid operators because they allow them the flexibility to meet the variable loads demanded throughout the day.4
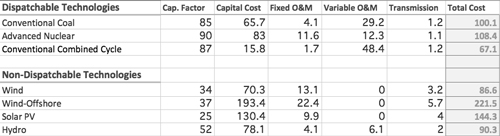
Figure 7: Levelized Costs For Various Generation Technologies (US Energy Information Administration, 2013) Grid ConsiderationsThe intermittent supply of solar and wind power raises concerns about the stability of the grid. This intermittency, coupled with the unequal demand, could cause blackouts if supply was at a low while demand was at a high (around 4pm). Conversely, if there is not enough demand to meet the supply, blackouts could be caused by wind turbines overloading the transmission lines. Transmission lines, like highways, are limited by their capacity, and large surges of energy can cause them to overload and shutdown, which can potentially cause nationwide voltage drop and subsequent blackout (Cardwell, 2013).
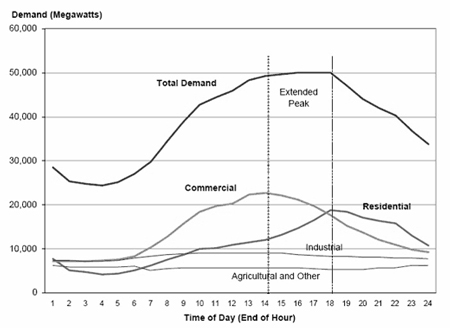
Figure 8: A Typical Load Profile (Lawrence Berkeley National Laboratory, 2005) A typical grid operator will want a base load, supplied by nuclear, coal, or natural gas, of around 50% of peak demand. This way, when the wind blows or the sun shines; there is still a demand node for the generated power to go to. However, since these renewable sources are intermittent, utility companies specify a certain percentage of dispatchable reserves (DR), which can be turned on, should there not be adequate renewable generation to satisfy demand. Gas turbine engines ordinarily generate these reserves. Usually, this reserve ratio is around 70%.
Once again, we will see how the intermittent nature of renewable generation technologies effects the optimal energy portfolio as the cost of building a wind or solar installation must also include a the cost of a fractional dispatchable installation. European Super GridOne of the proposed methods for avoiding the variability of wind and solar resources– other than using conventional dispatchable reserves– is to have a more integrated grid, where power could be transported anywhere in Europe for reasonable electrical losses. This would help smooth out the variability of wind speeds in a specific region5. The main obstacle to this is the construction of new high voltage direct current (HVDC) lines across the continent. However, this could conceivably be achieved in a decade (Claverton, 2009).Continued on Next Page » This article was published in A publication of University of Texas at Austin 
From the Inquiries Journal Blog   Related ReadingJournalQuest is a free program to help academic student publications increase online readership and distribution. If you are interested in enrolling a journal at your school, please visit the JournalQuest website. Monthly Newsletter SignupThe newsletter highlights recent selections from the journal and useful tips from our blog. Suggested Reading from Inquiries Journal
Inquiries Journal provides undergraduate and graduate students around the world a platform for the wide dissemination of academic work over a range of core disciplines. Representing the work of students from hundreds of institutions around the globe, Inquiries Journal's large database of academic articles is completely free. Learn more | Blog | Submit Follow IJ
Latest in Economics |